
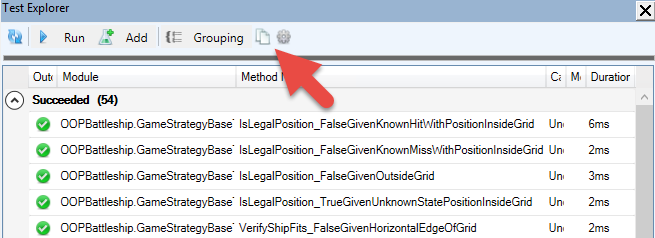
You’re writing a rather large VBA/VB6 project, and you’re starting to have a sizable amount of passing unit tests. Did you know you can copy the test results to the clipboard with a single click?
…and then paste them onto a new worksheet and turn it into a data table:

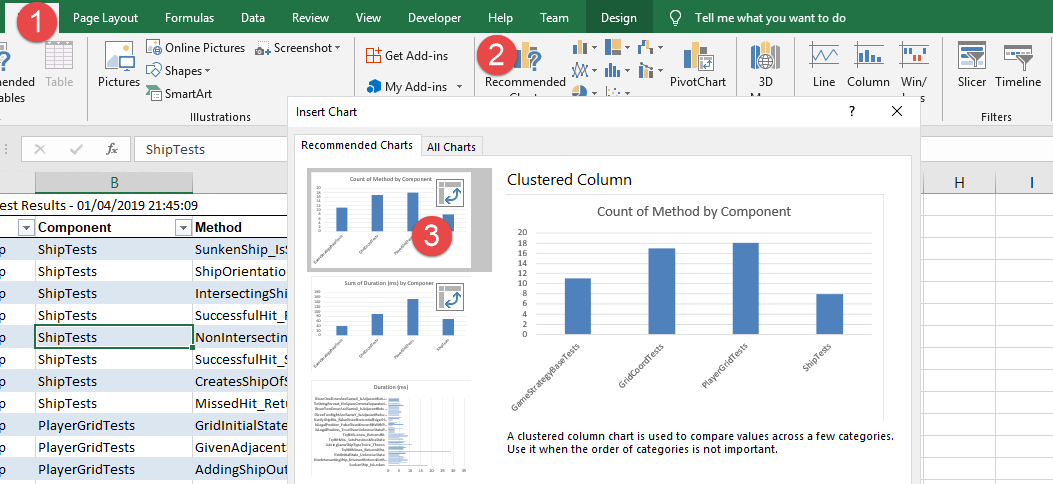
If you’re not sure what to do next, you can even let Excel give you ideas – you’ll find the Recommended Charts button under the Insert Ribbon tab:

With the count of method by component chart, we can see what test modules have more test methods; the sum of duration by component chart can show us which test modules take the longer to execute – or we could average it across test categories, or archive test results and later aggregate them… and then use this data to performance-profile problematic test scenarios.
Similarly, the “Copy to Clipboard” button from the Code Explorer can be used to export a table into Excel, and using the recommended pivot tables feature, we can get a detailed breakdown of the project – for example count of names by declaration type creates a pivot table that lists all Rubberduck declaration types, so you can easily know how many line labels your project has, or how many Declare Function imports are used:

With a little bit of filtering and creativity, we can regroup all Constant, Function, PropertyGet and Variable declarations by return type, and easily identify, say, everything that returns a Variant:

The possibilities are practically endless: the data could be timestamped and exported to some Access or SQL Server database, to feed some dashboard or report showing how a project grows over time.
How would you analyze your VBA projects? What code metrics would you like to be able to review and pivot like this? Share your ideas, or implement them, and send a pull request our way!
