Rubberduck docks a command bar at the top of the VBE. Like all command bars, it can be floated, or docked at the top, bottom, or either sides of the editor.
Because the VBE doesn’t tell us when the code changes, we needed to have a piece of UI that was easily accessible, so that parsing the code and refreshing Rubberduck’s internal representation (and understanding) of the code. The first command bar button fulfills this role, and we use the button’s label to display the current parser state.
The VBE doesn’t have a status bar either, and we needed one to be our “window” to Rubberduck’s parser state; we use it to describe the current selection. And if we know that the selection is used in 10 places, we give you a button to navigate to them.
The VBE only gives you the coordinates of the last character in the current selection:

Given a multiple-character selection, Rubberduck’s command bar gives you the position of both the first and the last characters:

The Rubberduck command bar has 4 or 5 parts, depending on whether you’re running a release or a debug build:
- Refresh button. Run this command to synchronize Rubberduck with the IDE after making changes. Rubberduck will launch an asynchronous parse task for every module that was modified since the last refresh. Default hotkey is Ctrl+`.
- Serialize button. Only visible in a Debug build; serializes the referenced COM type libraries to XML files. These files can then be used to import declarations for Rubberduck’s unit tests.
- Selection Position label. Describes the current position of the cursor in the active code pane, using a L1C1 (Line/Column) notation.
- Selection Info label. Describes the currently selected declaration, or describes the scope the cursor is located in.
- All References button. Run this command to open a new tab in Rubberduck’s Search Results dockable toolwindow, showing all instructions the selected identifier is referred to. This is essentially a shortcut to the find all references command, which can also be found under Rubberduck’s code pane context menu.
Find all References
While the VBE’s find (Ctrl+F) tool does allow restricting the scope of a search (current procedure/module/project) and the find whole word only option is rather effective, it remains a “match string” search.

Find all references is more than that. Not only you get all results at once and no longer need to iterate the search results one by one, you can see them all in context, and navigate to any of them by double-clicking on the search result:

Go to implementation
Coding against interfaces is nice, but a side-effect of this decoupling is that, well, the code is decoupled from concrete implementations – and the code alone isn’t necessarily enough to know specifically which concrete implementation is running, and the VBE won’t tell you which classes implement the interface, so without Rubberduck, you’re on your own.
This command opens a new search results tab showing all implementations of the selected member:

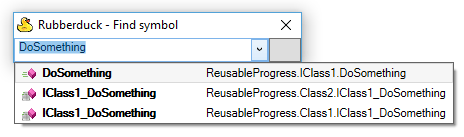
Find Symbol
If you’re looking for anything that has a name – be it a variable, a module, a parameter, or even a line label – you can bring up this dialog (default hotkey Ctrl+T), type what you’re looking for, and Rubberduck will take you there instantly.